Index and Commodities Trading week beginning 29 / 12 / 2025
 XJO WEEKLY
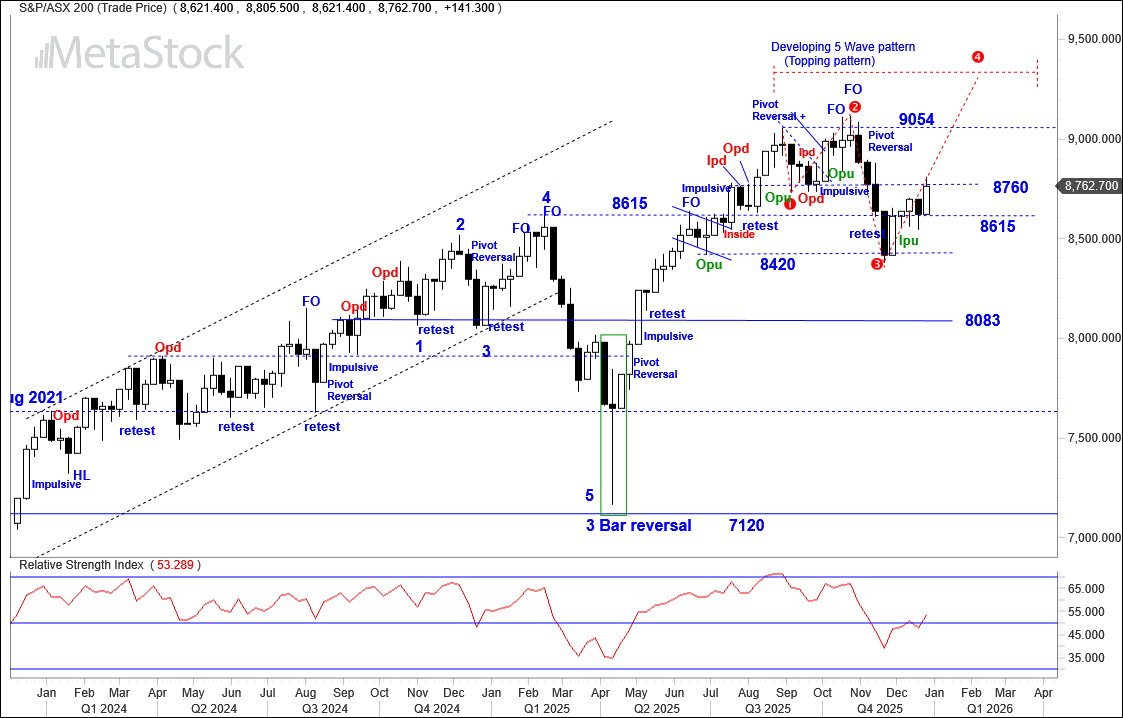
Price structure: Developing 5 Wave
The weekly chart of the XJO is now showcasing a maturing five‑wave topping structure, with wave 4 currently unfolding. This corrective phase has so far behaved in line with typical fourth‑wave dynamics, retracing enough to reset sentiment without meaningfully damaging the broader uptrend. Provided this structure continues to hold, the technical expectation is for the index to resolve higher into a final push past 9600 point registering a new all‑time high. That advance would then complete the larger wave 5 termination sequence, setting the stage for a more pronounced and sustained decline as the full cycle reaches exhaustion.
This pattern can fail and may take many months to resolve, for now the Bullish bias remains into a new high.
Indicator: Relative strength 14: Rejection
Relative strength has turned higher above the key 50 level in line with the current price movement in the Index value. Only further movements over the 50 towards the 70 level can set a continuing bullish signal for price movements.
The RSI turning further lower to move further below the 50 level, is a strong indication for negative momentum to develop leading to Up Trend failure and further declines.
XJO WEEKLY
Price structure: Developing 5 Wave
The weekly chart of the XJO is now showcasing a maturing five‑wave topping structure, with wave 4 currently unfolding. This corrective phase has so far behaved in line with typical fourth‑wave dynamics, retracing enough to reset sentiment without meaningfully damaging the broader uptrend. Provided this structure continues to hold, the technical expectation is for the index to resolve higher into a final push past 9600 point registering a new all‑time high. That advance would then complete the larger wave 5 termination sequence, setting the stage for a more pronounced and sustained decline as the full cycle reaches exhaustion.
This pattern can fail and may take many months to resolve, for now the Bullish bias remains into a new high.
Indicator: Relative strength 14: Rejection
Relative strength has turned higher above the key 50 level in line with the current price movement in the Index value. Only further movements over the 50 towards the 70 level can set a continuing bullish signal for price movements.
The RSI turning further lower to move further below the 50 level, is a strong indication for negative momentum to develop leading to Up Trend failure and further declines.
 Comments last week:-
The Weekly chart of the XJO200 reveals a period of consolidation centred around the 8615 level, which is emerging as a pivotal zone of both support and resistance. This price behaviour suggests a temporary equilibrium between buyers and sellers, with neither side exerting decisive control. The repeated interaction with 8615, marked by multiple touches and rejections since January 2025, indicates that market participants are closely watching this level for directional cues. Breakout strategies targeting the next resistance band near 8760, and breakdown scenarios eyeing support near 8420. The observation of wave analysis would indicate a move towards the 9054 level being a Wave 4 in this potential 5 Wave top.
XJO DAILY
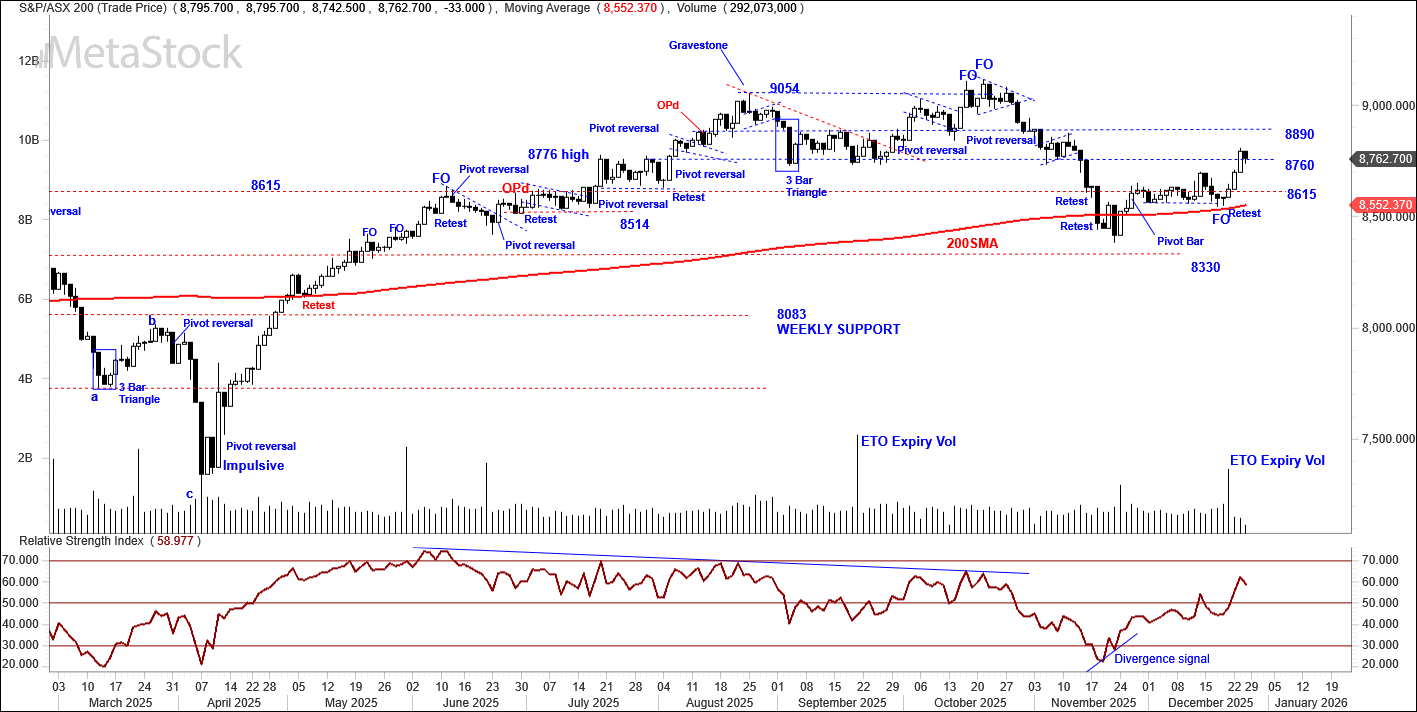
Price structure: 200 MA retest
The daily view of the XJO continues to emphasise the importance of the 200‑day moving average, which has repeatedly acted as a reliable dynamic support zone throughout the current consolidation. Each dip into this region has been met with stabilising demand, reinforcing the broader bullish bias despite the choppy short‑term structure.
The index has been able to rebuild upward momentum past the 8760 support/resistance level, positioning price for another approach toward the 8890-resistance level. A further retest of this barrier now appears likely in the coming trading week.
Indicator: Relative strength 14: Bullish momentum
RSI following day to day price movements in this short consolidation from the 8615 level past the 8760 level. Relative strength moving back towards the key 70 level shows increasing Bullish momentum. Price failure and a further move lower below the 50 level will indicate a loss of positive momentum, a short-term traders sell signal.
Comments last week:-
The Weekly chart of the XJO200 reveals a period of consolidation centred around the 8615 level, which is emerging as a pivotal zone of both support and resistance. This price behaviour suggests a temporary equilibrium between buyers and sellers, with neither side exerting decisive control. The repeated interaction with 8615, marked by multiple touches and rejections since January 2025, indicates that market participants are closely watching this level for directional cues. Breakout strategies targeting the next resistance band near 8760, and breakdown scenarios eyeing support near 8420. The observation of wave analysis would indicate a move towards the 9054 level being a Wave 4 in this potential 5 Wave top.
XJO DAILY
Price structure: 200 MA retest
The daily view of the XJO continues to emphasise the importance of the 200‑day moving average, which has repeatedly acted as a reliable dynamic support zone throughout the current consolidation. Each dip into this region has been met with stabilising demand, reinforcing the broader bullish bias despite the choppy short‑term structure.
The index has been able to rebuild upward momentum past the 8760 support/resistance level, positioning price for another approach toward the 8890-resistance level. A further retest of this barrier now appears likely in the coming trading week.
Indicator: Relative strength 14: Bullish momentum
RSI following day to day price movements in this short consolidation from the 8615 level past the 8760 level. Relative strength moving back towards the key 70 level shows increasing Bullish momentum. Price failure and a further move lower below the 50 level will indicate a loss of positive momentum, a short-term traders sell signal.
 Comments last week
The breakout discussed last week has so far failed to develop into a sustained continuation move to the upside. Instead of following through with impulsive buying, the Index has slipped into a more measured, sideways movement suggesting that the market is content to consolidate around the 8615 level. This behaviour often reflects a temporary balance between Bullish continuation and short-term selling, with neither side exerting enough pressure to force a decisive directional move.
Importantly, this consolidation is occurring above the 200‑day moving average, which continues to function as a major support zone.
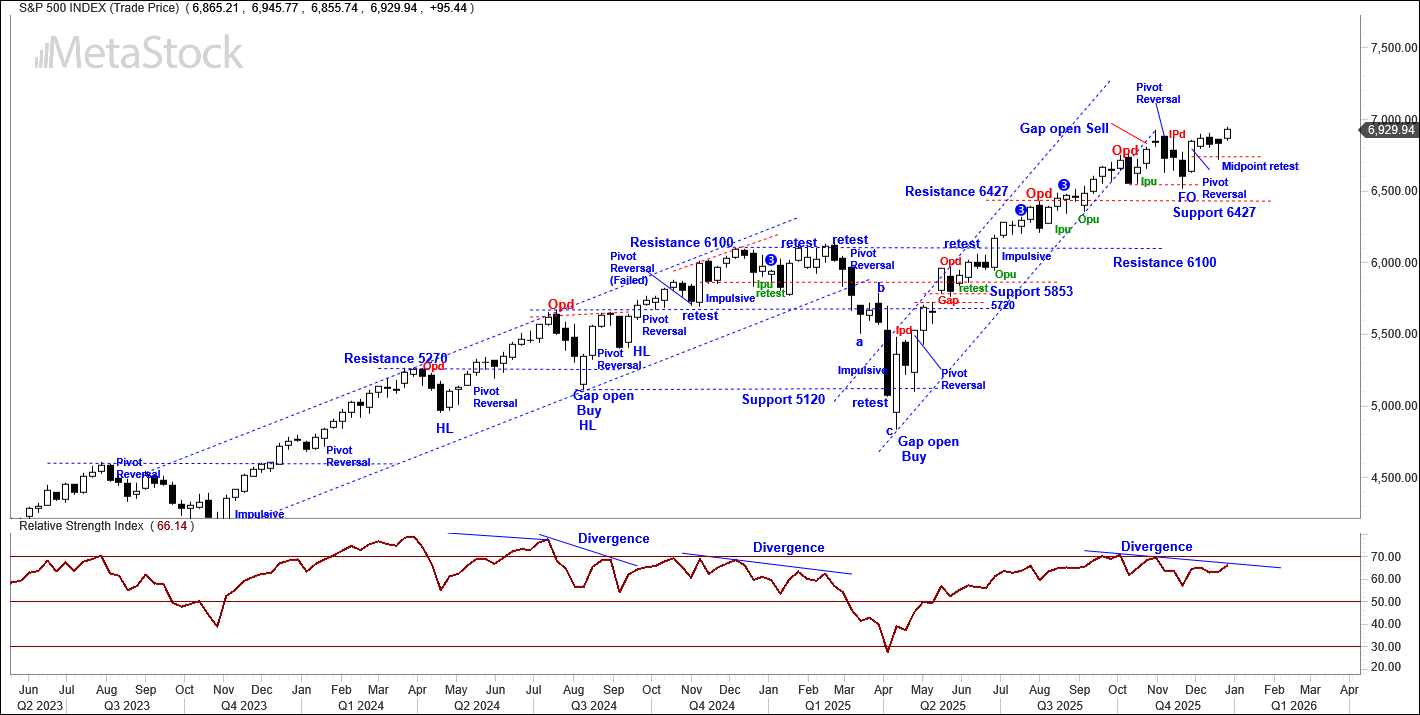
S&P 500 WEEKLY: Breakout
A fresh weekly all‑time high in the S&P firmly resets the broader trend and reinforces the underlying strength that has been building from the Mid-point support of the Pivot bar set 3 weeks ago. This breakout signals that the recent consolidation phase has likely run its course, with the index now transitioning from digestion back into expansion with a price target of 7000 points. The move not only confirms persistent demand at higher levels but also opens the door for further upside follow‑through as momentum re‑accelerates. With resistance now converted into 9600 support, the market enters a phase where incremental gains provided from buyers maintain control and volatility remains contained.
Indicator: Relative strength 14.
The turning movement to lower levels below the 70 line shows a momentum slowing signal. Price action will remain strong only when the RSI is travelling above the 70 level. As price consolidates the RSI naturally moves lower as momentum slows, in the past week the RSI has turned higher. A move below this important area back towards the 50 level may develop into a full sell signal.
Comments last week
The breakout discussed last week has so far failed to develop into a sustained continuation move to the upside. Instead of following through with impulsive buying, the Index has slipped into a more measured, sideways movement suggesting that the market is content to consolidate around the 8615 level. This behaviour often reflects a temporary balance between Bullish continuation and short-term selling, with neither side exerting enough pressure to force a decisive directional move.
Importantly, this consolidation is occurring above the 200‑day moving average, which continues to function as a major support zone.
S&P 500 WEEKLY: Breakout
A fresh weekly all‑time high in the S&P firmly resets the broader trend and reinforces the underlying strength that has been building from the Mid-point support of the Pivot bar set 3 weeks ago. This breakout signals that the recent consolidation phase has likely run its course, with the index now transitioning from digestion back into expansion with a price target of 7000 points. The move not only confirms persistent demand at higher levels but also opens the door for further upside follow‑through as momentum re‑accelerates. With resistance now converted into 9600 support, the market enters a phase where incremental gains provided from buyers maintain control and volatility remains contained.
Indicator: Relative strength 14.
The turning movement to lower levels below the 70 line shows a momentum slowing signal. Price action will remain strong only when the RSI is travelling above the 70 level. As price consolidates the RSI naturally moves lower as momentum slows, in the past week the RSI has turned higher. A move below this important area back towards the 50 level may develop into a full sell signal.
 Comments from last week
The S&P500 continues to consolidate below the 6900 level, the lower shadow of last weeks candle suggest cautious Buying remains as price trades at the high of the earlier Pivot reversal Bar of 4 weeks ago. The high range close shows late buying. A decisive close over the 6900 level would be very Bullish for further gains. With the current close towards the all-time closing high of 3 weeks prior, the market remains Bullish within the current Primary UP Trend.
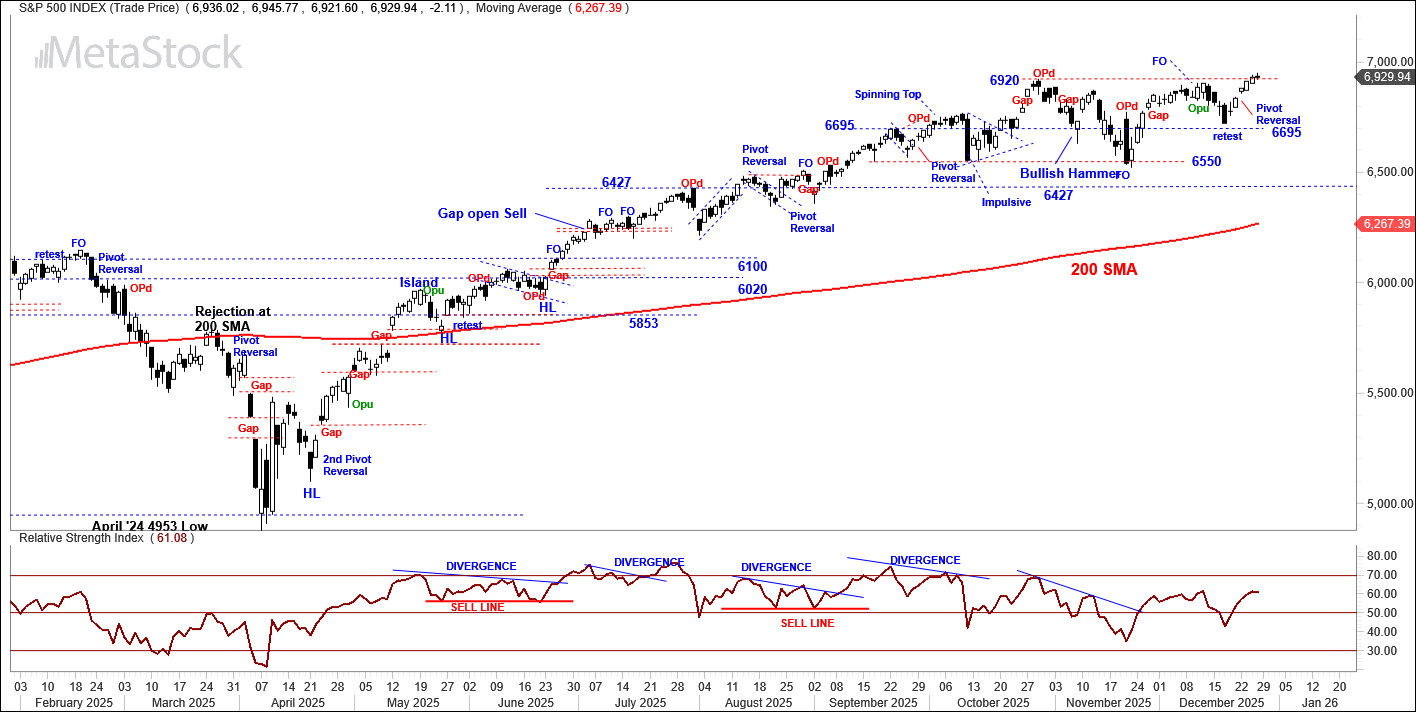
SPX DAILY
Price structure: Resistance tested
A fresh weekly all‑time high in the S&P firmly reinforces the broader trend and reinforces the underlying strength that has been building beneath the surface recently. This breakout signals that the recent consolidation phase has likely run its course, with the index now transitioning from digestion back into expansion. The move not only confirms persistent demand at higher levels but also opens the door for further upside follow‑through as momentum re‑accelerates. With resistance now converted into support, the market enters a phase where incremental gains can unfold more freely, provided buyers maintain control and volatility remains contained.
Indicator: Relative strength 14. Bullish
The Relative Strength Indicator (RSI) having moved higher from below the key 50 level. This important level is the swing level between, positive or negative price momentum. Only if the RSI continues to rise from the current level to remain over pivotal 50 level, with a movement towards and over the 70 level will likely confirm a further short-term Bullish outlook.
Comments from last week
The S&P500 continues to consolidate below the 6900 level, the lower shadow of last weeks candle suggest cautious Buying remains as price trades at the high of the earlier Pivot reversal Bar of 4 weeks ago. The high range close shows late buying. A decisive close over the 6900 level would be very Bullish for further gains. With the current close towards the all-time closing high of 3 weeks prior, the market remains Bullish within the current Primary UP Trend.
SPX DAILY
Price structure: Resistance tested
A fresh weekly all‑time high in the S&P firmly reinforces the broader trend and reinforces the underlying strength that has been building beneath the surface recently. This breakout signals that the recent consolidation phase has likely run its course, with the index now transitioning from digestion back into expansion. The move not only confirms persistent demand at higher levels but also opens the door for further upside follow‑through as momentum re‑accelerates. With resistance now converted into support, the market enters a phase where incremental gains can unfold more freely, provided buyers maintain control and volatility remains contained.
Indicator: Relative strength 14. Bullish
The Relative Strength Indicator (RSI) having moved higher from below the key 50 level. This important level is the swing level between, positive or negative price momentum. Only if the RSI continues to rise from the current level to remain over pivotal 50 level, with a movement towards and over the 70 level will likely confirm a further short-term Bullish outlook.
 Comments from last week
From the Fake out high of 2 weeks ago leading to the retest lower towards 6695 the Index remains within a tight range. A Daily close over 6920 points would potentially be very strong signal for the Buyers and force a short covering move higher. Two key levels remain in place, support at 6550 and resistance at 6920, a price breakdown from the 6550 level would signal a major top in place. Conversely a move above the 6920 level offers a consolidation zone breakout with a 7000 point level target. The current Pivot point reversal is the first signal of higher prices to come.
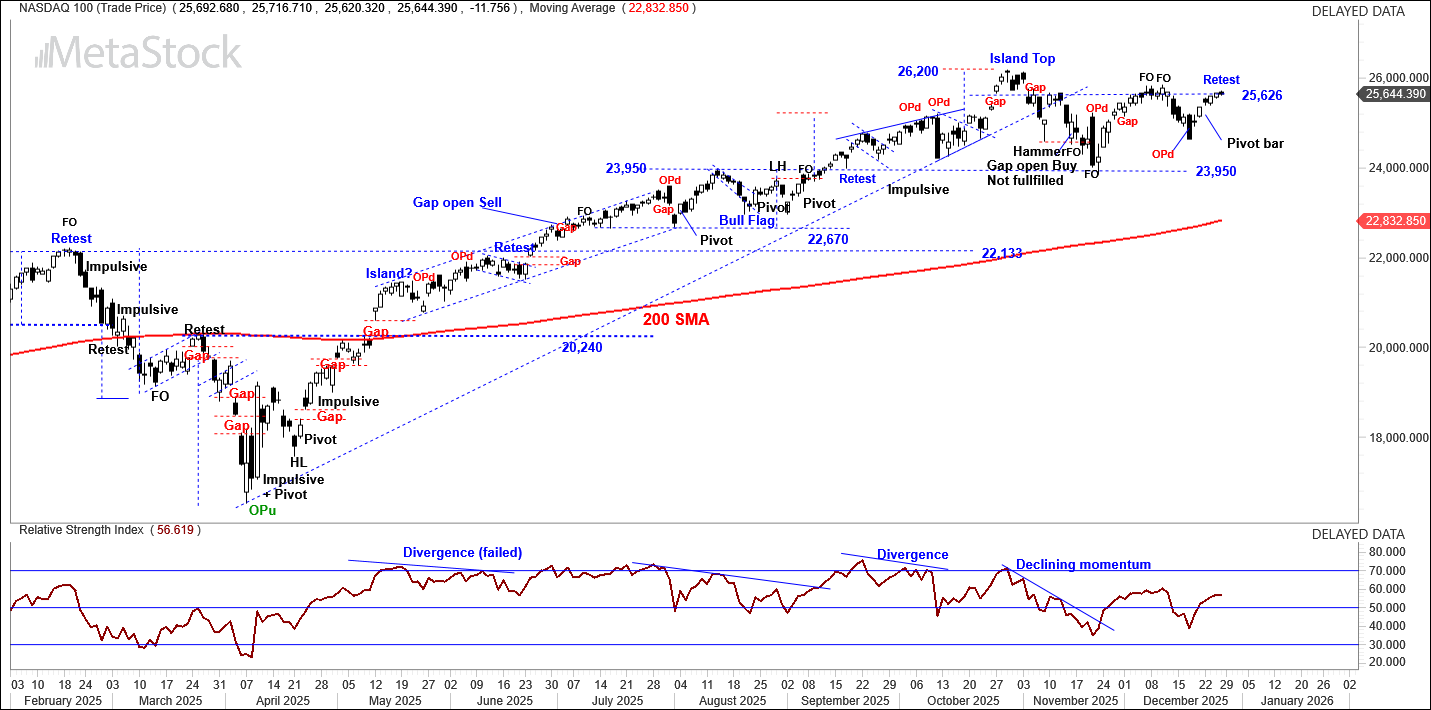
NASDAQ (100) DAILY Price structure: Resistance
The Outside‑down OPd range has effectively defined the swing low, providing a clear reference point for the current recovery phase. Price has since rallied back toward the 25,626 area, but importantly, this advance still sits beneath the Island Top formation established in late October. That overhead structure remains a significant technical barrier, both psychologically and structurally, as it represents the point where buyers previously lost control in a decisive gap‑driven reversal. Until price can reclaim and close above that Island Top, the broader tone of the market remains corrective rather than impulsively bullish, with the current rally best viewed as a retracement into resistance rather than a confirmed trend reversal
Indicator: Relative strength 14: Bullish momentum
Relative strength has been increasing for the past week from having turned lower to move below the key 50 level, a Bearish indication. A reversal back over this important level and continued move higher over this key level and towards the 70 level is a strong signal to maintain a Bullish outlook.
Comments from last week
From the Fake out high of 2 weeks ago leading to the retest lower towards 6695 the Index remains within a tight range. A Daily close over 6920 points would potentially be very strong signal for the Buyers and force a short covering move higher. Two key levels remain in place, support at 6550 and resistance at 6920, a price breakdown from the 6550 level would signal a major top in place. Conversely a move above the 6920 level offers a consolidation zone breakout with a 7000 point level target. The current Pivot point reversal is the first signal of higher prices to come.
NASDAQ (100) DAILY Price structure: Resistance
The Outside‑down OPd range has effectively defined the swing low, providing a clear reference point for the current recovery phase. Price has since rallied back toward the 25,626 area, but importantly, this advance still sits beneath the Island Top formation established in late October. That overhead structure remains a significant technical barrier, both psychologically and structurally, as it represents the point where buyers previously lost control in a decisive gap‑driven reversal. Until price can reclaim and close above that Island Top, the broader tone of the market remains corrective rather than impulsively bullish, with the current rally best viewed as a retracement into resistance rather than a confirmed trend reversal
Indicator: Relative strength 14: Bullish momentum
Relative strength has been increasing for the past week from having turned lower to move below the key 50 level, a Bearish indication. A reversal back over this important level and continued move higher over this key level and towards the 70 level is a strong signal to maintain a Bullish outlook.
 Comments from last week.
The Nasdaq ahs set a Pivot point reversal to close out last week, a Bullish signal within the larger consolidation area below the 26,200-resistance point and current Support level shown at 23,950. As this consolidation has developed from early September, the Primary Trend has remained UP, last Wednesday the Index has set a higher low confirmed with the Pivot bar confirmed on Friday.
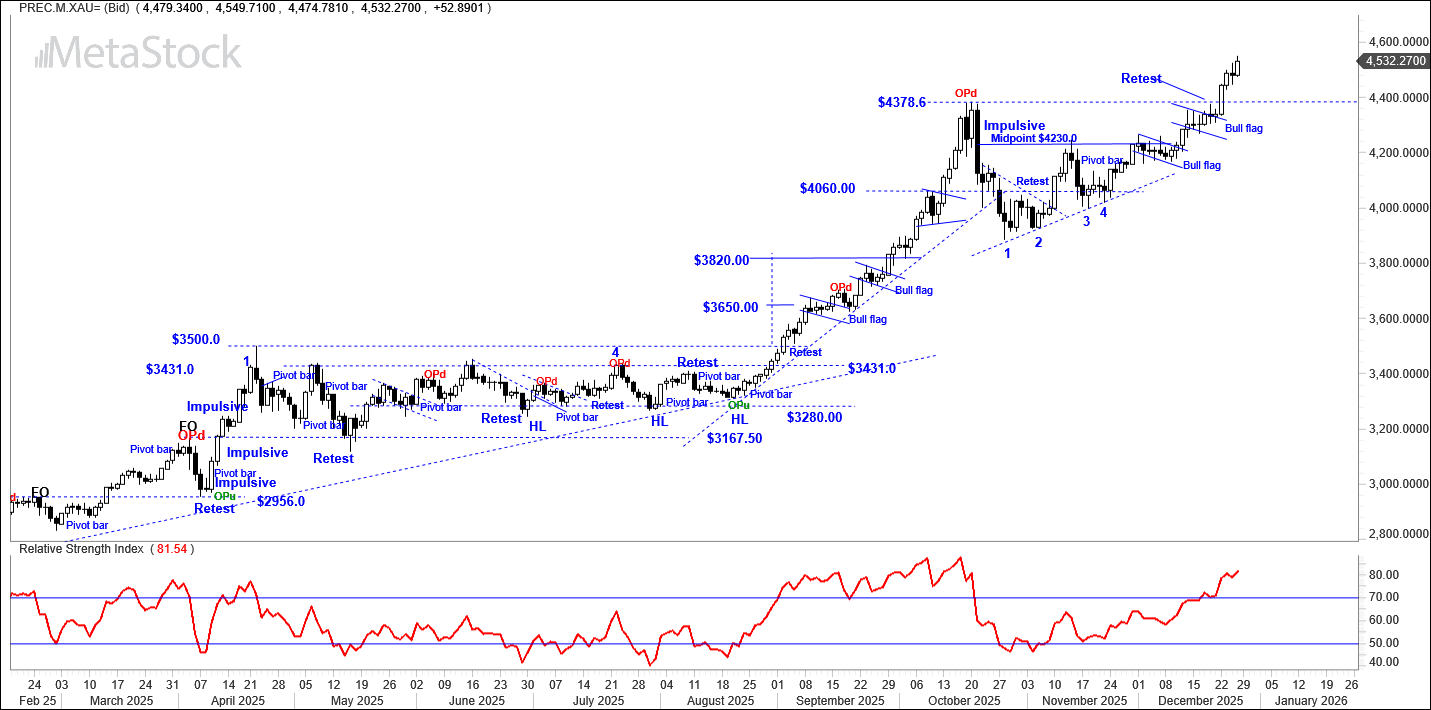
USD Spot GOLD – DAILY: Bullish flag Breakout
USD Gold has delivered a decisive breakout from the Bullish flag discussed last week into a continuation move, pushing well beyond the $4,378.60 level without offering a retest of that key breakout point. The absence of any pullback underscores the strength of underlying demand and highlights that Buyers remain firmly in control of the trend. Momentum has stayed robust throughout the advance, with each session reinforcing the broader bullish structure rather than signalling exhaustion. This sustained strength is being fuelled by a supportive macro backdrop, where ongoing global and geopolitical developments continue to drive capital toward the precious metal as a preferred asset. Until price action shows evidence of fatigue or a meaningful retracement, the path of least resistance remains to the upside.
Indicator: Relative Strength 14: Positive Momentum
The RSI has remained above the 50 level and has now crossed the 70 level, this a Bullish reading, this is typical during a structural price consolidation following a short momentum move from the Bullish flag pattern. However, should the RSI reading decrease in the coming week further lower towards the 50 level, this will reflect a potential larger exhaustion signal. Short term holders and traders should continue to monitor the RSI for a movement remaining above the 50 level as an overall Buy signal.
Comments from last week.
The Nasdaq ahs set a Pivot point reversal to close out last week, a Bullish signal within the larger consolidation area below the 26,200-resistance point and current Support level shown at 23,950. As this consolidation has developed from early September, the Primary Trend has remained UP, last Wednesday the Index has set a higher low confirmed with the Pivot bar confirmed on Friday.
USD Spot GOLD – DAILY: Bullish flag Breakout
USD Gold has delivered a decisive breakout from the Bullish flag discussed last week into a continuation move, pushing well beyond the $4,378.60 level without offering a retest of that key breakout point. The absence of any pullback underscores the strength of underlying demand and highlights that Buyers remain firmly in control of the trend. Momentum has stayed robust throughout the advance, with each session reinforcing the broader bullish structure rather than signalling exhaustion. This sustained strength is being fuelled by a supportive macro backdrop, where ongoing global and geopolitical developments continue to drive capital toward the precious metal as a preferred asset. Until price action shows evidence of fatigue or a meaningful retracement, the path of least resistance remains to the upside.
Indicator: Relative Strength 14: Positive Momentum
The RSI has remained above the 50 level and has now crossed the 70 level, this a Bullish reading, this is typical during a structural price consolidation following a short momentum move from the Bullish flag pattern. However, should the RSI reading decrease in the coming week further lower towards the 50 level, this will reflect a potential larger exhaustion signal. Short term holders and traders should continue to monitor the RSI for a movement remaining above the 50 level as an overall Buy signal.
 Comments from last week:
USD Gold continues to consolidate below the $4378.60 October resistance point. Price action last week has developed into a Bullish Flag pattern. Trader may expect a further breakout higher as this pattern develops. Developments in Central bank actions and narratives will continue to drive price rather than general retail buying.
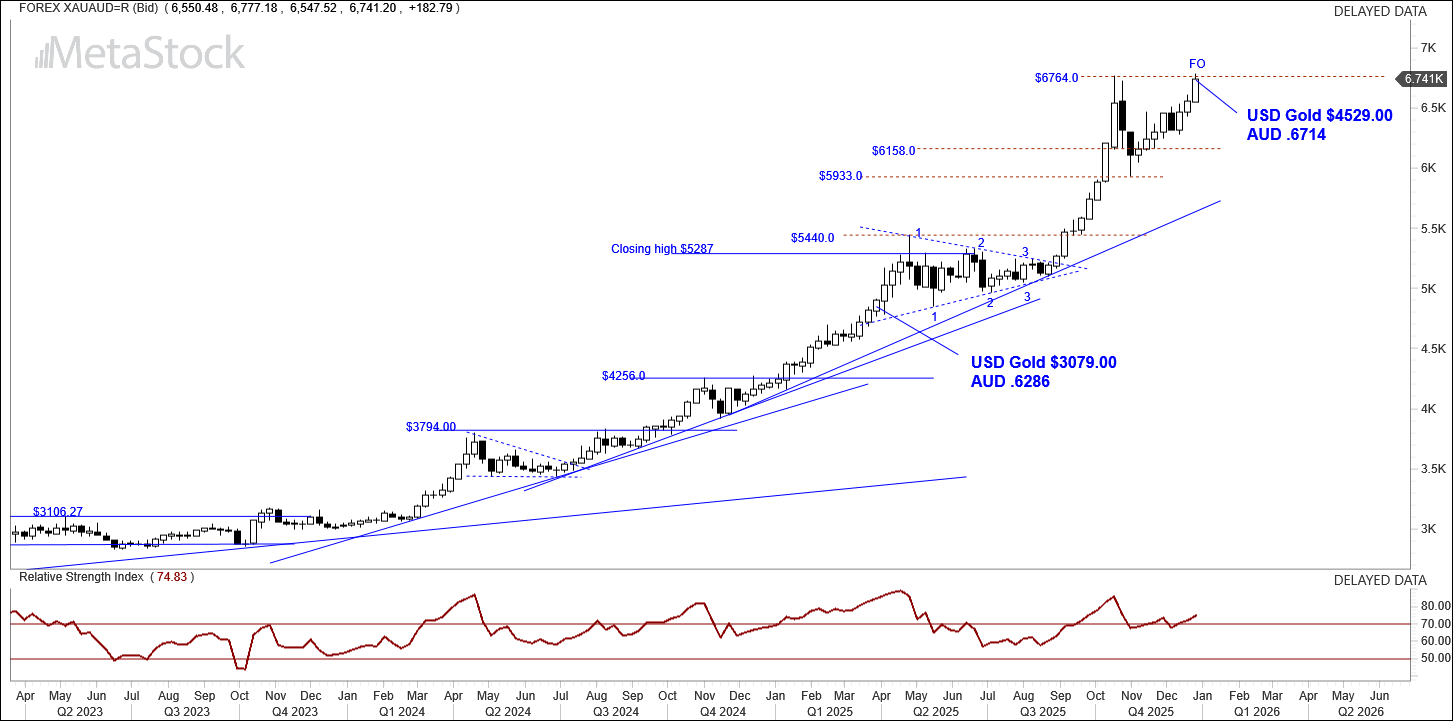
AUD GOLD – DAILY: New all-time closing high
The expanded range of the Australian Dollar Gold price mirrors the USD Gold price with a stable Australian dollar in the background. As the USD Gold price Primary UP trend remains intact the current Primary trend in the AUD price of gold could be expected to continue higher. The remains a very Bullish indicator for Australian Gold producers. The current bar remains a fake out high retesting
Indicator: Relative Strength 14: Neutral
The short rally last week has lifted the RSI back to remain above the 70 level. At this juncture momentum remains Bullish until a retest of the 50 level takes place The relative strength is now at risk of developing a lower swing high and divergence sell signal in the coming weeks. Australian Gold producers remain within well-defined UP Trends.
Comments from last week:
USD Gold continues to consolidate below the $4378.60 October resistance point. Price action last week has developed into a Bullish Flag pattern. Trader may expect a further breakout higher as this pattern develops. Developments in Central bank actions and narratives will continue to drive price rather than general retail buying.
AUD GOLD – DAILY: New all-time closing high
The expanded range of the Australian Dollar Gold price mirrors the USD Gold price with a stable Australian dollar in the background. As the USD Gold price Primary UP trend remains intact the current Primary trend in the AUD price of gold could be expected to continue higher. The remains a very Bullish indicator for Australian Gold producers. The current bar remains a fake out high retesting
Indicator: Relative Strength 14: Neutral
The short rally last week has lifted the RSI back to remain above the 70 level. At this juncture momentum remains Bullish until a retest of the 50 level takes place The relative strength is now at risk of developing a lower swing high and divergence sell signal in the coming weeks. Australian Gold producers remain within well-defined UP Trends.
 Comments from last week.
With the current advance in the USD Gold price to $4347.0 has moved the $AUD Gold price higher. The Australian dollar has remained relatively stable around the $0.66c level. An advance in the $AUD will place pressure on the AUD Gold price. Currently the price movements remain very Bullish for Australian based producer Gold stocks. Listed Gold explorers pricing will remain incumbent to drilling and exploration results.
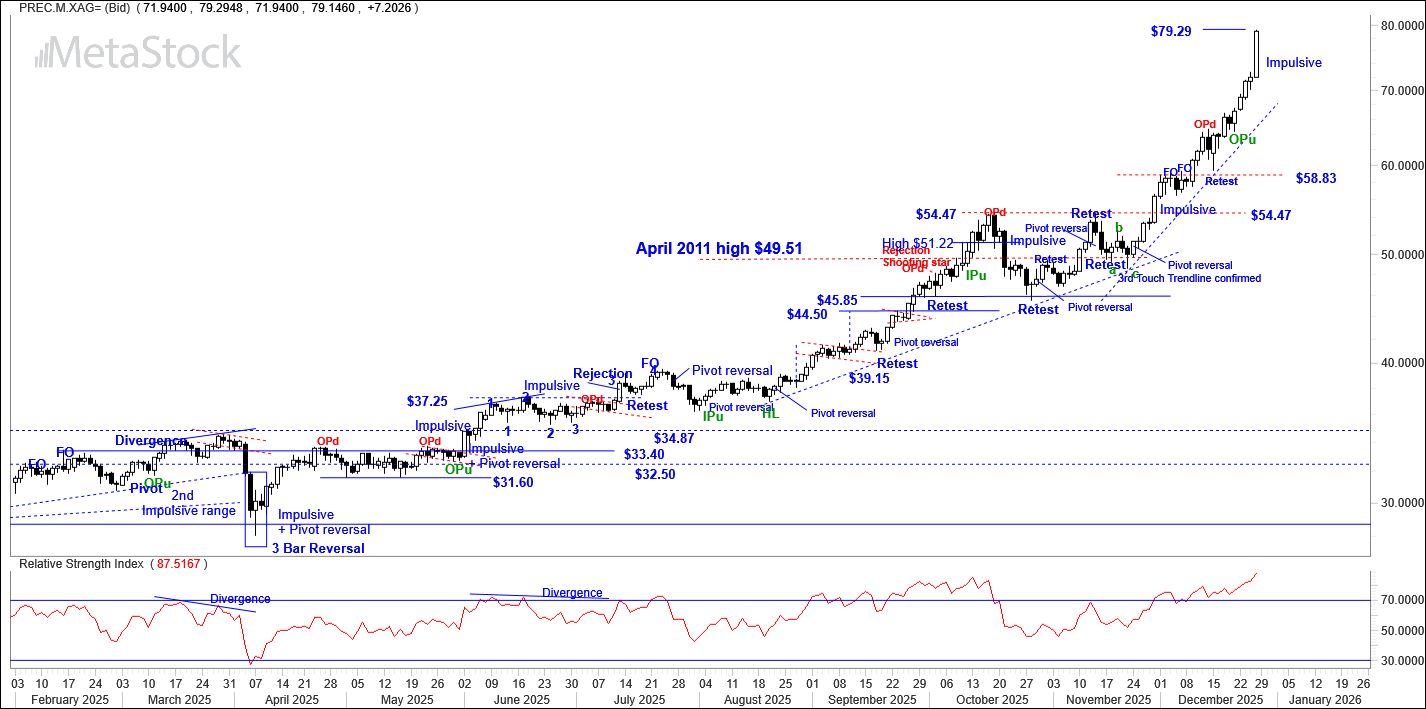
SILVER
Price structure: Exponential price movement
USD Silver has entered a distinctly exponential phase, driving price sharply higher toward the USD $80 region and ultimately USD$100/oz. The advance over recent months has been characterised by persistent upside momentum, with remarkably few meaningful sell bars appearing throughout the climb. This type of price behaviour reflects a market dominated by aggressive, one‑way buying pressure, where each minor pause is quickly absorbed and momentum traders continue to chase strength.
However, exponential structures carry their own inherent risks. When a trend becomes this extended and one‑sided, the absence of regular profit‑taking can create a vacuum beneath price. Should sentiment shift or buyers simply step aside, the market can experience a swift and disorderly retracement as participants rush to lock in gains, a reversal close below $75 may indicate this outcome.
Relative strength 14: Strong momentum
The relative strength index (RSI) has moved to align with the price expansion. This movement indicates a directional increase of momentum and sets a strong indication a consolidation phase may emerge.
Comments from last week.
With the current advance in the USD Gold price to $4347.0 has moved the $AUD Gold price higher. The Australian dollar has remained relatively stable around the $0.66c level. An advance in the $AUD will place pressure on the AUD Gold price. Currently the price movements remain very Bullish for Australian based producer Gold stocks. Listed Gold explorers pricing will remain incumbent to drilling and exploration results.
SILVER
Price structure: Exponential price movement
USD Silver has entered a distinctly exponential phase, driving price sharply higher toward the USD $80 region and ultimately USD$100/oz. The advance over recent months has been characterised by persistent upside momentum, with remarkably few meaningful sell bars appearing throughout the climb. This type of price behaviour reflects a market dominated by aggressive, one‑way buying pressure, where each minor pause is quickly absorbed and momentum traders continue to chase strength.
However, exponential structures carry their own inherent risks. When a trend becomes this extended and one‑sided, the absence of regular profit‑taking can create a vacuum beneath price. Should sentiment shift or buyers simply step aside, the market can experience a swift and disorderly retracement as participants rush to lock in gains, a reversal close below $75 may indicate this outcome.
Relative strength 14: Strong momentum
The relative strength index (RSI) has moved to align with the price expansion. This movement indicates a directional increase of momentum and sets a strong indication a consolidation phase may emerge.
 Comments from last week.
The Silver chart is displaying a developing exponential advance in price, the short term trendlines are becoming steeper. This type of price development historically leads to a profit taking event. Traders would monitor the trendline development with a price crossing and closing below being the first indication a potential top is in place. Macro development continues to drive price as demand begins to exceed a perceived shortage in supply.
BITCOIN
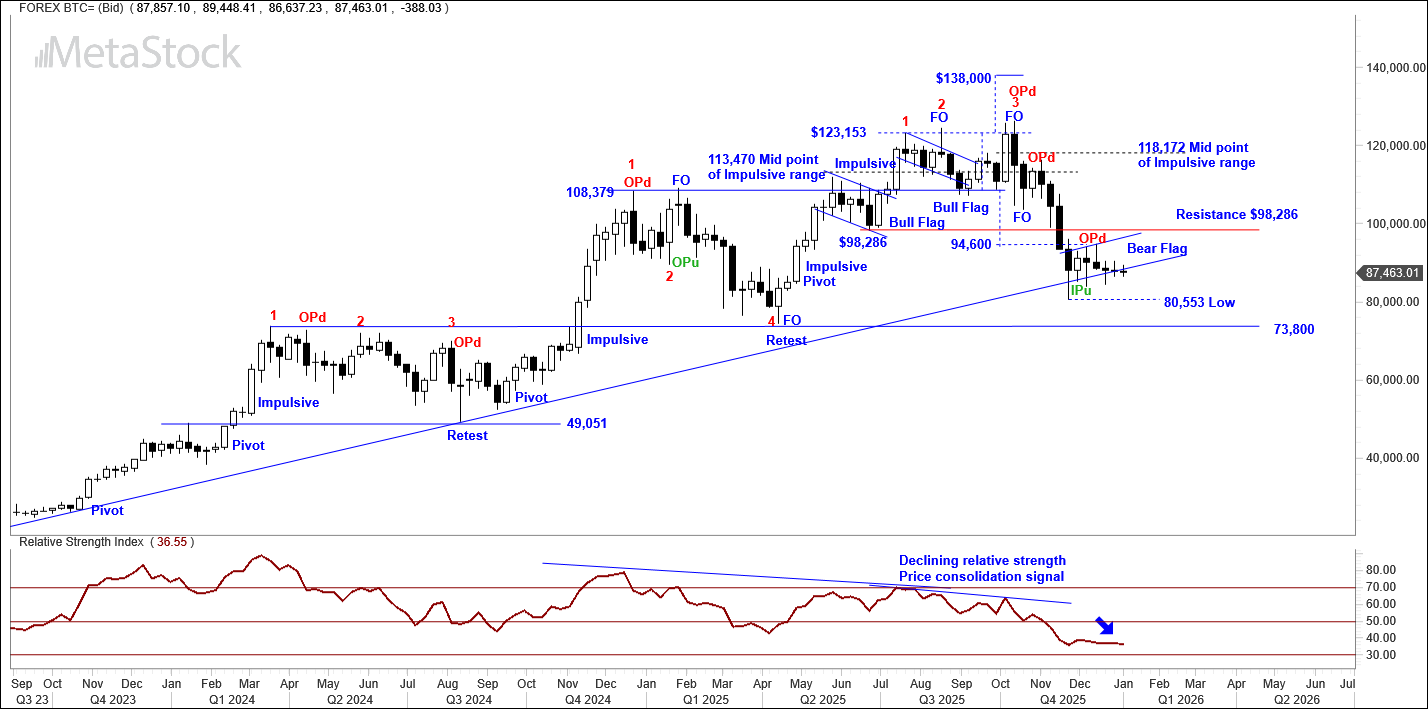
Bear flag remains
Bitcoin continues to consolidate at the lower Trendline, the Bear flag development has the potential to playout into lower prices towards the $73,800 level. From the start of the year Bitcoin remains down over 10% and within a large consolidation area between $123,153 Resistance and $73,800 as the key support level. Traders would only look for a close over the $98,286 level to assign a Bullish view to price.
Relative strength 14: Negative
Relative Strength remains in sync with the underlying price movements. Momentum is declining as price consolidates, the RSI has moved below the key 50 level indicating momentum remains negative.
Comments from last week.
The Silver chart is displaying a developing exponential advance in price, the short term trendlines are becoming steeper. This type of price development historically leads to a profit taking event. Traders would monitor the trendline development with a price crossing and closing below being the first indication a potential top is in place. Macro development continues to drive price as demand begins to exceed a perceived shortage in supply.
BITCOIN
Bear flag remains
Bitcoin continues to consolidate at the lower Trendline, the Bear flag development has the potential to playout into lower prices towards the $73,800 level. From the start of the year Bitcoin remains down over 10% and within a large consolidation area between $123,153 Resistance and $73,800 as the key support level. Traders would only look for a close over the $98,286 level to assign a Bullish view to price.
Relative strength 14: Negative
Relative Strength remains in sync with the underlying price movements. Momentum is declining as price consolidates, the RSI has moved below the key 50 level indicating momentum remains negative.
 Comments from last week.
Bitcoin continues to consolidate at the lower Trendline, the Bear flag development has the potential to playout into lower prices towards the $73,800 level. From the start of the year Bitcoin remains down over 10% and within a large consolidation area between $123,153 Resistance and $73,800 as the key support level. Traders would only look for a close over the $98,286 level to assign a Bullish view to price.
IMPORTANT DISCLAIMER
The information in this report is of a general nature only. It is not personal financial product advice. It does not take into account your objectives, financial situation, or needs.
You should therefore consider the appropriateness of this general information in light of these statements. The Australian School of Technical Analysis (www.astatrading.com) recommend that you refer to the Product Disclosure Statements of any financial products which are discussed in this report before making any investment decisions.
ASTA accepts no responsibility for your actions and recommends you contact a licensed advisor before acting on any information contained in this general information report.
Comments from last week.
Bitcoin continues to consolidate at the lower Trendline, the Bear flag development has the potential to playout into lower prices towards the $73,800 level. From the start of the year Bitcoin remains down over 10% and within a large consolidation area between $123,153 Resistance and $73,800 as the key support level. Traders would only look for a close over the $98,286 level to assign a Bullish view to price.
IMPORTANT DISCLAIMER
The information in this report is of a general nature only. It is not personal financial product advice. It does not take into account your objectives, financial situation, or needs.
You should therefore consider the appropriateness of this general information in light of these statements. The Australian School of Technical Analysis (www.astatrading.com) recommend that you refer to the Product Disclosure Statements of any financial products which are discussed in this report before making any investment decisions.
ASTA accepts no responsibility for your actions and recommends you contact a licensed advisor before acting on any information contained in this general information report.Publication date:
2025-12-29 11:10:03 (GMT)